


Transparent glass-ceramics of CaO–Bi2O3–B2O3 (CBBO) were fabricated using the conventional melt quench technique. X-ray diffraction and Raman spectroscopy were employed to confirm the phase of the prepared samples. Differential scanning calorimetry (DSC) was used to verify that the material was, indeed, glassy. The CBBO glass samples were subjected to heat treatment at 540 °C for 30 min and 1 h based on their crystallization temperature obtained from DSC analysis. This study focused on the piezocatalytic behavior of CBBO glass-ceramic samples. Piezocatalysis experiments were conducted on the fabricated glass-ceramic samples, and it was discovered that the samples heat-treated for 30 min (HT30m) at 540 °C showed maximum dye degradation of 61% under 240 min of ultrasonication. Experiments were repeated multiple times to confirm their reliability. Additionally, a phytotoxicity assessment was performed on the degraded dye using vigna radiata seeds. The antibacterial properties of the CBBO glass-ceramic samples were also investigated via piezocatalysis. It was discovered that the HT30m CBBO glass-ceramic sample removes 98% of Escherichia coli and 99% of Staphylococcus aureus bacteria within 120 min of ultrasonication.
I. INTRODUCTION
Glass-ceramics are a unique class of materials due to several merits such as ease of manufacturing, low cost, tunable microstructure, and stable mechanical, chemical, and thermal properties.1,2 Hence, glass-ceramics have been used in a wide range of applications. Several glass-ceramics are now trademarks of products such as Zerodur, Gorilla Glass, and 45S5 Bioglass.3 In further exploring the horizon of glass-ceramics in the sustainable growth of society, glass-ceramics can be re-looked at for environmental remediation applications. The environment is constantly being threatened by various contaminants present in the water, soil, and air.4,5 These contaminants comprise fatal chemicals and, due to the risks they threaten to an ecosystem, will directly or indirectly affect human health.6 As always, clean water, clean soil, and clean air are key components to sustain life on Earth, so the remediation of polluted environments is an immediate necessity. Water cleaning is one of the global challenges and needs the attention of researchers. Various materials have shown water-cleaning possibilities in view of adsorption, photocatalysis, and antibacterial characteristics.7 For instance, TiO2 is widely known for its photocatalytic activity.8 Furthermore, ferroelectric ceramics have shown better performance in view of photocatalysis due to the associated internal electric field. The internal electric field supports the separation of electrons and holes for a long time and provides a longer duration of catalytic reactions.9 Materials such as BaTiO3, LiNbO3, and Ba0.5Sr0.5TiO3 are well explored.10–13 Recently, ferroelectric glass-ceramics have also been reported for photocatalytic applications.14–17 Ferroelectric materials are known for their piezoelectric and pyroelectric properties. Electromechanical and electrothermal coupling allows sensing and energy harvesting possibilities. These properties are widely explored in single crystals, polycrystalline ceramics, polymer composites, etc. However, ferroelectric glass-ceramics have not shown any promising sensing and energy harvesting application due to very weak coupling. Piezocatalysis is one of the couplings where mechanical vibrations can trigger an electric field followed by catalysis.18 As catalysis requires less input energy, ferroelectric glass-ceramics may show some promising signals irrespective of very weak coupling. The present study is planned to explore such possibilities. Glass-ceramics are a suitable candidate for water-cleaning applications via piezocatalysis.19 Some recent studies have reported glass-ceramics as a catalyst for water-cleaning applications via piezocatalysis.20,21
CaBi2B2O7 (CBBO) fabricated via a solid-state reaction route has recently been explored and reported for its non-centrosymmetric structure, which is essential for piezocatalytic activity.22 Due to the presence of borate (a good glass former), the above-mentioned composition can be melted at a lower temperature and CBBO is expected to quench into glasses at a moderate temperature range. Glass-ceramics containing non-centrosymmetric crystals within the glass matrix can demonstrate piezocatalysis. The present study focuses on the use of CaBi2B2O7 (CBBO) glass-ceramics for piezocatalysis applications.
II. EXPERIMENTAL
CaO–Bi2O3–B2O3 (CBBO) transparent glasses were prepared through the conventional melt quench technique. High-purity reagents (>99%) of CaCO3, H3BO3, and Bi2O3 were taken in their stoichiometric ratios for the fabrication of CBBO glasses. The powders of the primary precursors were appropriately mashed in a mortar and pestle to ensure compositional homogeneity, and afterward, the powder mix was poured into a platinum crucible. The crucible with the prepared powder is placed in an electric furnace (Nabertherm, Germany). The temperature of the furnace is set at 1000 °C. The crucible was subjected to an established temperature for 10 min. The crucible was taken out from the furnace, and the melt was poured onto a stainless-steel plate to quench the glass. The plate was preheated to 300 °C and then compressed with a second plate heated to 300 °C. The process of quenching glass is shown in Fig. 1.

Annealing of the prepared glass was done at 350 °C for 5 h. The crystallization of the samples was accomplished by heat treatment to the transparent yellow CBBO glass plate for various time durations. Differential scanning calorimetry (DSC) was performed (with Perkin Elmer, STA-6000 instrument) in the range of 350–600 °C at a heating rate of 10 °C/min in a nitrogen environment to assess the temperature and time duration of the heat treatment. In accordance with the DSC, samples were heated to 540 °C for 30 min and 1 h for crystallization. X-ray diffraction (XRD) was performed on the as-quenched (AQ) and heat-treated samples of CBBO glass plates to confirm their amorphous and crystalline nature. X-ray diffraction analysis was performed using a Rigaku (Japan) powder diffractometer with a 9 kW rotating anode made of Cu Kα. The XRD experimental was performed in the range of 10°–70° 2θ range with a scanning speed of 2°/min for the identification of the present phase in CBBO glass and glass-ceramic samples under consideration. After getting confirmation regarding phase, Raman spectroscopy was performed to get knowledge about various vibration modes using HORIBA (Model-lab RAM HR Evolution) for the fabricated samples of CBBO glass and glass-ceramics (AQ, HT30m, and HT1h). To examine the surface morphology of the samples, field emission-scanning electron microscopy (FE-SEM, NOVA NANO SEM-450) was utilized. X-ray photoemission spectroscopy (XPS) was used to study the oxygen states in the form of non-binding and binding oxygen by O1s scans of samples under consideration. The spectra were recorded using an Al-Kα source and a Nexsa x-ray photoemission spectrophotometer.
III. RESULTS AND DISCUSSION
Differential scanning calorimetry (DSC) was performed on the as-quenched sample of the CBBO glass plate to determine the glass transition (Tg), the onset of the crystallization (Tcr), and the peak crystallization (Tp) temperatures. The obtained trace of DSC for the CBBO glass plate is shown in Fig. 2. The DSC curve represents the glass transition temperature, and the exothermic peak represents the crystallization of the glass plate as a function of temperature. The nucleation and development of crystals in the CBBO glass plate are responsible for the transition from the glassy to the crystalline phase. It is well established that the method of crystallization affects the formation of exothermic peaks, with sharp and broad peaks corresponding to the surface and bulk crystallization, respectively. The obtained broad peak of the exotherms shows the dominance of surface crystallization.

X-ray diffraction (XRD) was performed and plotted (Fig. 3) for the as-quenched (AQ) glass with the heat-treated samples of the CBBO glass-ceramic plate. The obtained plots of XRD clearly show the transformation from the glassy phase of the AQ glass plate to the crystalline phase of the heat-treated glass-ceramic samples. As the duration of heat treatment is varied from 30 min to 1 h, the glass sample transformation is observed as the glass converts into a glass-ceramic. The glass-ceramic under investigation indicated the crystallization with planes (113) and (020) for the 30-min heat-treated sample and with planes (002), (011), (111), (113), (210), (013), (020), (310), (312), (221), and (400) for the 1-h heat-treated sample in orthorhombic phase. These observed planes are in good agreement with the polycrystalline CBBO, as it is confirmed that the transformation of the amorphous phase to the crystalline phase of glass under consideration can be achieved by the heat-treatment process.22

XRD plots of the AQ, 30-min heat-treated (HT30m), and 1-h heat-treated (HT1h) glass samples at 540 °C.
XRD plots of the AQ, 30-min heat-treated (HT30m), and 1-h heat-treated (HT1h) glass samples at 540 °C.
Raman spectroscopy in the range of 100–1200 cm−1 was performed at room temperature for the prepared CBBO glass and glass-ceramic samples. The material under consideration CaBi2B2O7 (CBBO) in the orthorhombic space group is a novel structure type belonging to CaBi2O(BO3)2.26 The crystal structure of the CBBO is an arrangement of layers built of corner-sharing BO3 in a triangular form and CaO6 in a trigonal prism with Bi2O groups accommodated within six-membered rings. For the crystal lattice of CBBO, four formula units per primitive cell are there. The layers of BO3 triangles held together by O–Bi–O bridges are the common motif in the case of CaBi2B2O7. The Raman active modes of samples under investigation can be classified into two categories as a low-frequency group (<350 cm−1) and a high-frequency group (>350 cm−1). The responsible compound for the low-frequency vibration modes is Bi–O polyhedral, while the high-frequency spectra are dominated by B–O triangles.27 The observed spectra of the AQ, HT30m, and HT1h samples of the CBBO glass-ceramic plate are shown in Fig. 4. The transformation of the amorphous phase to the crystalline phase in the heat-treated samples can be observed as the broadening and sharpening of the peaks, which is also confirmed by the XRD. The observed peaks at 108, 128, 174, 228, 307, and 343 cm−1 are due to the heavy metal ion vibrational modes and vibrational modes in the borate framework. The modes observed at 585 and 628 cm−1 are due to the bending vibration state of (BO3)3−.28

Scanning electron microscopy (SEM) was performed, and images were collected for the CBBO glass and glass-ceramic samples as shown in Fig. 5. Figure 5(a) corresponds to the as-quenched glass sample, and it has been observed that there are no crystals present on the surface of the sample confirming the glassy nature. The optical image of the sample is also shown (inset) with SEM micrographs indicating the physical appearance of the sample as a transparent glass. Figure 5(b) shows the SEM micrograph of the 30 min heat-treated glass-ceramic sample at 540 °C, confirming the formation of crystals on the surface of the glass-ceramic sample. Figure 5(c) shows the morphology of a 1-h heat-treated sample at 540 °C with its optical image (inset). It has been observed that the glass is transformed into a glass ceramic.
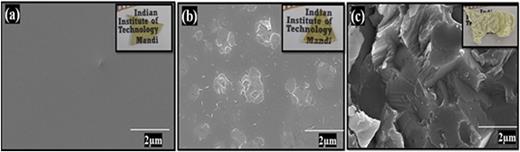
SEM images of the (a) as-prepared (AQ), (b) HT30m, and (c) HT1h samples. The insets show optical images.
SEM images of the (a) as-prepared (AQ), (b) HT30m, and (c) HT1h samples. The insets show optical images.
X-ray photoelectron microscopy (XPS) was utilized to identify the surface chemical state and chemical composition of the CBBO glass and glass-ceramic samples. Figure 6 shows the obtained spectra, in which Fig. 6(a) is the survey representing the presence of the elements in CBBO glass. The changes in the oxygen state of the AQ, HT30m, and HT1h CBBO glass-ceramic samples are shown in Figs. 6(b)–6(d). Oxygen concentration in a sample can be measured in terms of bridging sites (BO) and non-bridging sites (NBO).29 According to the crystal structure of glass under consideration, the bridging sites are occupied by the two units of BiO4 connected by the covalent bond of Bi–O–Bi and the non-bridging sites are the result of network modifiers mixed in the glass matrix, such as Ca+2.30 It has been found that the effect of network modifiers due to the crystallization of CBBO glass-ceramic by heat treatment in the glass matrix increases NBO and decreases BO, which is shown by the O1s spectra of the AQ, HT30m, and HT1h heat-treated samples.31 The splitting of peaks in the O1s spectra of the heat-treated samples can be seen as shown in Figs. 6(c) and 6(d) having two peaks at 529.12 and 530.78 eV for HT30m and at 529.9 and 532 eV for HT1h CBBO glass-ceramic sample, which correspond to non-bridging sites and bridge sites.
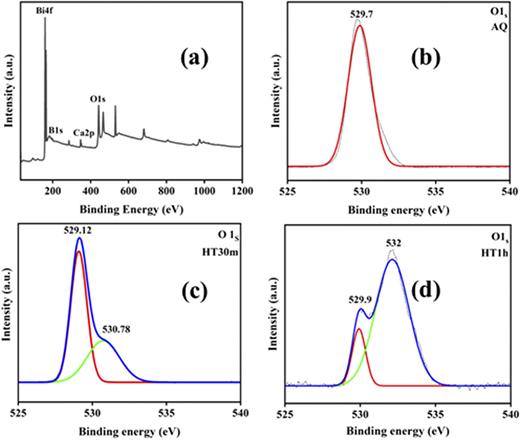
XPS: (a) survey, (b) O1s spectrum (AQ glass), (c) O1s spectrum (HT30m glass-ceramic), and (d) O1s spectrum (HT1h glass-ceramic) samples.
XPS: (a) survey, (b) O1s spectrum (AQ glass), (c) O1s spectrum (HT30m glass-ceramic), and (d) O1s spectrum (HT1h glass-ceramic) samples.
The fabricated CBBO glass-ceramic samples were used to get the absorbance spectra from the UV–visible spectroscopy in the range of 200–800 nm of wavelength. The observed spectra are shown in Fig. 7(a), and it has been discovered that as glass is crystallized into glass-ceramic samples, the absorbance rises, while the transparency falls. The transparency of the prepared glass-ceramic samples of CBBO is acquired with UV–visible spectroscopy, and it was found that the AQ glass sample of CBBO has a transparency of 72% and HT30m has 68% transparency, respectively, also plotted and shown in Fig. 7(b). There is no denying that the crystallization reduces transparency. The HT1h sample is transformed into a glass-ceramic after the crystallization takes place with zero transparency, which can be confirmed by the digital images shown in Fig. 5 (inset).

(a) Absorbance plot and (b) transparency results of the CBBO glass-ceramic samples.
(a) Absorbance plot and (b) transparency results of the CBBO glass-ceramic samples.
C = the dye concentration at time t;
C0 = the dye concentration at time t0; and
k = the rate constant.
![(a) Absorbance spectra of the HT30m CBBO glass-ceramic. [(b) and (c)] Results for kinetic rate. (d) Obtained degradation with samples under consideration.](https://aipp.silverchair-cdn.com/aipp/content_public/journal/ape/1/1/10.1063_5.0141938/1/m_016105_1_5.0141938.figures.online.f8.jpeg?Expires=1716293105&Signature=J7Yyr4xtw1MgJb7CXDc99PrWIjrKWSoiMVDNIwWasCGUQpT7el~5r-4dZAczRqlDfBXCZKmkJg7e4MpJ2ghjZmr35o8P01oEv-dVEyOPAGW6UV0N5jM0uxNNQnULBkIhG9WVQHjVBrr7aMJ8x5zMYA7o-NU3ZrYex2A83JMCxsozqEXlKiOjIobce8i0N5O0H0ubG-7qQnTpIV2io-s8JU7CNOJZbS2BCMrDC9pvk~3vSo4IYWCf2M~QakmBrBjRNWpL60P3Fa1ekaVmt-UXuV-qGTc89abHRhk5sq73dufMLd4KcNZInMbONlt0Ern57ctBxh~aTYJUgEcjZodjAQ__&Key-Pair-Id=APKAIE5G5CRDK6RD3PGA)
(a) Absorbance spectra of the HT30m CBBO glass-ceramic. [(b) and (c)] Results for kinetic rate. (d) Obtained degradation with samples under consideration.
(a) Absorbance spectra of the HT30m CBBO glass-ceramic. [(b) and (c)] Results for kinetic rate. (d) Obtained degradation with samples under consideration.
Using CBBO glass-ceramic samples, we determined the degradation rate constants (k), calculated as shown in Fig. 8(c). 0.0005, 0.0009, 0.0045 and 0.0018 min−1 are the obtained slopes for the control MB dye, AQ, HT30m, and HT1h glass-ceramic sample of CBBO, respectively. Among the prepared glass-ceramic samples, HT30m showed the highest dye degrading capability, with the highest k value of 0.0045 min−1. It is because the HT30m sample has a lower crystalline size, which contributes to a higher specific surface area. With the increase in temperature/time of heat treatment, the crystal grows and the specific surface area decreases.
To understand more about the mechanism involved in piezocatalysis dye degradation using the CBBO glass-ceramic samples, a scavenger test is carried out. The maximum efficient CBBO glass-ceramic sample heat-treated at 540 °C for 30 min (HT30m) is used for radical tapping (Scavenger) experiments by degrading MB. Ethylenediaminetetraacetic acid (EDTA), isopropanol (IPA), and p-benzoquinone (BQ) were used to mitigate the holes (h+), hydroxyl radicals (.OH), and superoxide radicals (.O2) generated during piezocatalysis.33,34 The obtained results for the scavenger test, as shown in Fig. 9(a), indicate that EDTA more significantly inhibits degradation as compared to BQ and IPA, which shows the involvement of primary reactive species h+ in the degradation process via piezocatalysis. Experiments for piezocatalysis dye degradation were performed several times using the prepared CBBO glass-ceramic samples to check the reliability, as shown in Fig. 9(b). To our knowledge, no massive changes occurred in the obtained data. Thus, the CBBO glass ceramic is a good candidate for piezocatalysis.

Borate-based materials with process parameters for different catalytic applications.
| Material | Material physical form | Catalytic dosage | Detection molecule | Degradation mechanism | Activity observed (%) | Power source | Reference |
|---|---|---|---|---|---|---|---|
| InBO3 | Powder | 0.325 mg/ml | Chlorophenol | Photo-catalysis | 92 | UV-light, λ > 30 nm | 38 |
| YBO3 | Powder | 3.33 mg/ml | Rhodamine B | Photo-catalysis | 90 | UV-light, λ > 250 nm | 39 |
| Bi4B2O9 | Powder | 0.5 mg/ml | Methylene blue | Photo-catalysis | 88 | Solar light | 40 |
| Zn4B6O13 | Powder | 1.6 mg/ml | Tetracycline solution | Photo-catalysis | 80 | UV-light | 41 |
| Bi2ZnOB2O6 | Powder | 3.33 mg/ml | Rhodamine B | Photo-catalysis | 98 | UV-light, λ > 250 nm | 42 |
| Na3VO2B6O1 | Powder | 1 mg/ml | Chlorophenol | Photo-catalysis | 82 | Visible light | 43 |
| NaZnB5O10 | Powder | 0.5 mg/ml | Chlorophenol | Photo-catalysis | 68 | UV-light | 44 |
| KZnB5O10 | Powder | 0.5 mg/ml | Chlorophenol | Photo-catalysis | 75 | UV-light | 44 |
| WO3–ZnO–B2O3 | Glass-ceramic | 1 mg/ml | Methylene blue | Photo-catalysis | 95 | UV-light, λ = 254 nm | 14 |
| SrO–Bi2O3–B2O3 | Glass-ceramic | 10 mm2/ml | Methylene blue | Photo-catalysis | 70 | UV-light, λ = 365 nm | 15 |
| Bi2ZnOB2O7 | Glass nanocomposite | 28 mm2/ml | Methylene blue | Piezocatalysis | 78 | Ultrasonicator, 150 W, 40 kHz | 45 |
| SrO–Bi2O3–B2O3 | Glass-ceramic | 32 mm2/ml | Methylene blue | Piezocatalysis | 51 | Ultrasonicator, 150 W, 40 kHz | 46 |
| CBBO (CaO–Bi2O3–B2O3) | Glass-ceramic | 28 mm2/ml | Methylene blue | Piezocatalysis | 68 | Ultrasonicator, 150 W, 40 kHz | The present study |
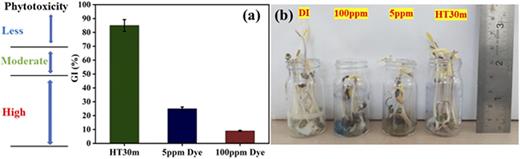
(a) GI for phytotoxicity of 5, 100 ppm, and the water treated using HT30m samples and (b) vials containing seed germination after 7 days with control sample and other samples under consideration.
(a) GI for phytotoxicity of 5, 100 ppm, and the water treated using HT30m samples and (b) vials containing seed germination after 7 days with control sample and other samples under consideration.
After the successful evaluation of the piezocatalytic performance of the CBBO glass-ceramic samples for the degradation of dye, the antibacterial activity was also investigated. The as-prepared (AQ) and heat-treated glass samples for 30 min of CBBO (HT30m) were used along with the control sample. The piezocatalytic activity was used to sterilize water contamination with S. aureus (gram-positive) and E. coli (gram-negative) bacteria for 120 min. The bacteria were piezocatalytically treated in the control (no sample), AQ, and HT30m samples. After the treatment, the solution containing the bacteria was spread over the LB agar and allowed to grow for 18 h under suitable conditions. As Figs. 11(a)–11(c) show, the number of colonies of the S. aureus bacteria had decreased after 120 min of treatment for all three samples under consideration. The same results were obtained in the case of E. coli after 120 min of ultrasonic treatment. The photographic images of plating are shown in Figs. 11(d)–11(f). It can be said that the prepared CBBO glass plate with or without heat treatment is an excellent candidate with antibacterial properties. A comparative evaluation has been done for all the samples under consideration and is plotted in the form of log reduction in Figs. 12(a) and 12(b) for the E. coli and S. aureus bacteria. The obtained results show that the heat-treated sample of the CBBO glass-ceramic for 30 min (HT30m) has a maximum log reduction in the CFUs/ml of bacteria. The possible reason for such a performance may be the generation of reactive oxygen species (ROS) during ultrasonication and the enhancement in the antibacterial performance with the use of the HT30m sample. The mechanism of antibacterial activity is not truly known to date, but it may encompass the formation of ROS that harm the cell membrane. The generation of ROS has been frequently linked to the piezocatalysis and antibacterial activity of many materials.48

(a)–(c) Optical images of the antibacterial performance of the control, AQ, and HT30m samples of the CBBO glass-ceramic plate of an S. aureus cell colony. (d)–(f) Optical images of the antibacterial performance of the control, AQ, and HT30m samples of the CBBO glass-ceramic plate of an E. coli cell colony.
(a)–(c) Optical images of the antibacterial performance of the control, AQ, and HT30m samples of the CBBO glass-ceramic plate of an S. aureus cell colony. (d)–(f) Optical images of the antibacterial performance of the control, AQ, and HT30m samples of the CBBO glass-ceramic plate of an E. coli cell colony.

(a) and (b) Time-dependent log reduction of CFUs/ml of E. coli and S. aureus for all the samples under consideration.
(a) and (b) Time-dependent log reduction of CFUs/ml of E. coli and S. aureus for all the samples under consideration.
IV. CONCLUSIONS
In this study, the CaO–Bi2O3–B2O3 (CBBO) transparent glass-ceramic was subjected to heat treatment at 540 °C for 30 min and 1 h, resulting in a decrease in transparency and an increase in crystallization. X-ray diffraction (XRD) and Raman analysis were utilized to confirm the phases and their nature in the prepared samples. Scanning electron microscopy (SEM) was used to examine the surface morphology of the CBBO glass-ceramic samples. The CBBO glass-ceramic samples exhibited an excellent piezocatalytic activity for dye degradation, with the heat-treated sample for 30 min at 540 °C (HT30m) demonstrating the greatest potential for dye degradation via piezocatalysis. The HT30m CBBO glass-ceramic sample exhibited a dye degradation rate of 0.0045 min−1. Moreover, phytotoxicity evaluation experiments were performed on vigna radiata seeds utilizing a byproduct generated from the degraded dye. When using the water treated with the CBBO glass-ceramic sample, the water phytotoxicity was found to be reduced by 85%, as previously demonstrated in a recent investigation. Furthermore, the antibacterial properties of the CBBO glass-ceramic samples were investigated via piezocatalysis. The HT30m CBBO glass-ceramic sample removed 98% of Escherichia coli and 99% of Staphylococcus aureus bacteria within 120 min of ultrasonication, highlighting its potential for antibacterial applications.
AUTHOR DECLARATIONS
Conflict of Interest
The authors have no conflicts to disclose.
Author Contributions
Chirag Porwal: Conceptualization (lead); Methodology (lead); Writing – original draft (lead); Writing – review & editing (equal). Vishal Singh Chauhan: Methodology (equal); Writing – review & editing (equal). Rahul Vaish: Conceptualization (equal); Writing – review & editing (equal).
DATA AVAILABILITY
The data that support the findings of this study are available within the article.